
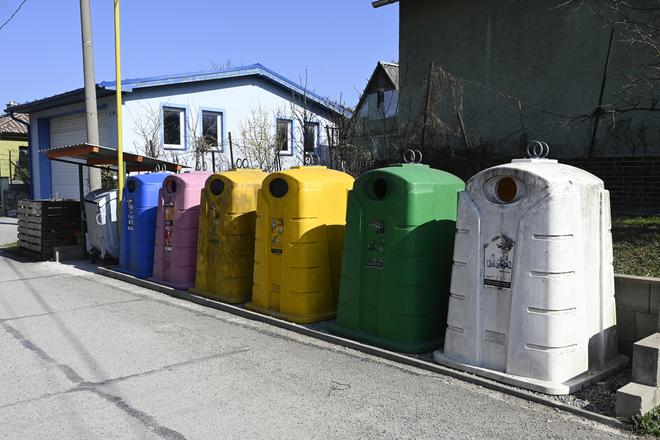
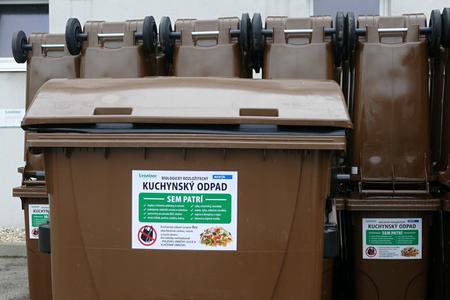
 Illustrative stock photo (source: TASR)
For the first time in Slovakia's history, less than half of the municipal waste was left at dumps last year.
Overall, 48 percent of the municipal waste ended up in dumps, the Statistics’ Office reported. One Slovak produced 446 kilograms of waste last year on average. Households together created almost €2.4 million tonnes of municipal waste.
More than 500 kilograms per inhabitant were disposed of by inhabitants of Trnava (584 kilograms), Bratislava (531 kilograms) and Nitra (521 kilograms) Region. Inhabitants of Prešov, Košice and Banská Bystrica Region generated the least waste. In these regions, the amount of waste per person did not exceed 400 kilograms.
In Prešov Region, one person produces on average two thirds less waste than in Trnava Region.
Regional differences
The Statistics Office claims that the rate of dumping waste is still high in Slovakia but is gradually improving. To compare, 69 percent of all municipal waste ended up in dumps in 2016.
The situation in regions significantly differs. While in Bratislava Region, only one-fourth of waste gets to the dump and in Košice Region only one-third, in other regions more than half of all waste is thrown into dumps.
The Statistics Office reasoned that this difference is due to the waste incinerator that Bratislava and Košice have. Bratislava Region burns almost 30 percent of its waste while Košice Region burns about 27 percent. Overall, only 8 percent of the waste is energetically used in all of Slovakia.
Share of recycled waste increases
There was a significant increase in the amount of municipal waste that was recycled. In 2020, 44 percent of waste was recycled, while it was only 15 percent some five years ago.
Trnava Region recycled the most last year (47.2 percent) and Košice Region the least (39.4 percent).

In addition to municipal waste management, its composition is also monitored. In terms of composition, the most represented type was mixed waste, which accounted for up to 47 percent of the total municipal waste. The share of sorted waste components is also increasing. Last year, the share of sorted components reached 29 percent. Only about 7 percent was sorted 10 years ago.
Sorted metals, paper, glass and plastics are the most represented in sorted municipal waste. The 2020 data shows that 54.4 percent of the total sorted waste in tonnes is metal and packaging from metals, the share of paper waste is 14.4 percent, glass 11.2 percent and plastics 9.8 percent.
